
Surprising fact: companies that monitor a few focused metrics reduce wasted effort by up to 40% in a year.
We built this guide to show Malaysian teams how our kpi template excel helps track business performance without building a dashboard from scratch.
In clear steps, we explain how to pick the right indicators, structure your data, and tailor the file so weekly or monthly reviews become fast and actionable.
Our goal is practical: turn raw numbers into decisions. After setup, you will spend less time on manual reports and more time on accountable actions that managers can read at a glance.
This guide suits SMEs, department heads, project managers, and operations teams in Malaysia. If you want hands-on help, message us on WhatsApp to know more about KPI @ +6019-3156508 and our local representative will be in touch within 24 hours.
Key Takeaways
- Use a simple file to standardize tracking across teams.
- Choose indicators tied to business goals, not vanity numbers.
- Structure data for easy weekly or monthly reporting.
- Customize visuals so managers see trends at a glance.
- Reduce manual work and speed up decision cycles.
- We offer local support for tailoring dashboards in Malaysia.
What a KPI Dashboard Is and Why It Matters for Malaysian Businesses
A good dashboard compresses weeks of reports into one glance that guides decisions.
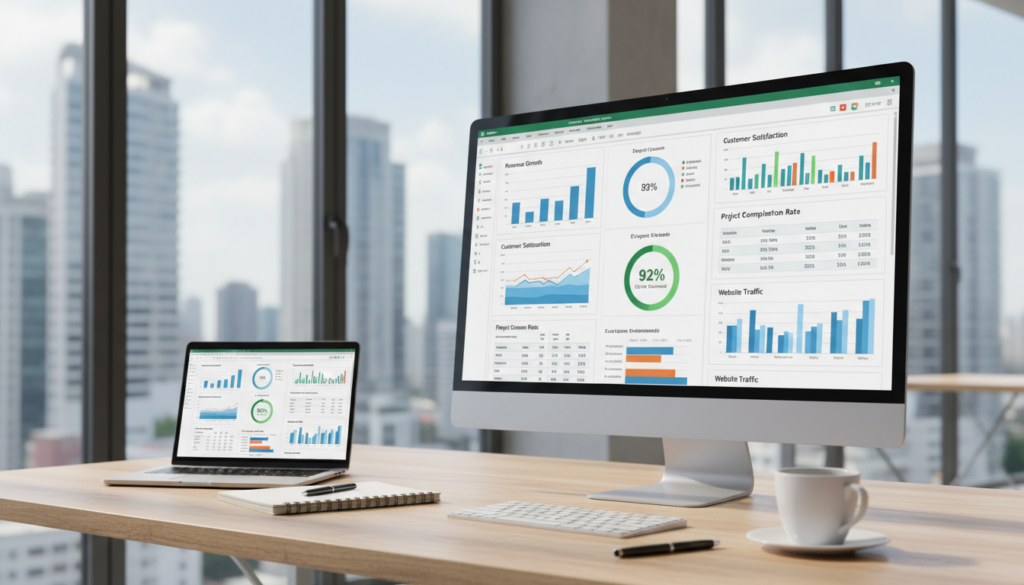
We define a kpi dashboard as a single-screen view that summarizes pre-set metrics with charts and status markers. It shows progress toward objectives and makes complex information easy to read in meetings.
How key performance indicators turn performance data into decisions
Key performance indicators translate raw numbers into clear targets, gaps, and trends. That clarity helps teams act immediately instead of debating sources.
Why one-screen dashboards help stakeholders see results at a glance
Single-screen dashboards give stakeholders a common reference for updates. This reduces back-and-forth and speeds up management decisions.
“When everyone looks at the same screen, meetings become about solutions, not data hunting.”
- Visibility: owners, targets, and results are visible.
- Speed: faster analysis and fewer status emails.
- Accountability: clear ownership for each performance indicator.
| Dashboard Value | Benefit | Example |
|---|---|---|
| Single-screen summary | Faster decisions | Weekly management review |
| Pre-set kpis | Consistent information | Monthly sales target tracking |
| Visual trends | Quick analysis | Traffic vs. conversion chart |
What You’ll Get in Our Free KPI Template (Excel Dashboard Template)
Start faster: our free dashboard package includes pre-built layouts that visualise progress immediately. We give teams a clean input area for tracking fields and a summary dashboard that displays KPIs with charts and graphs.
Pre-built layout: an input sheet for owners, targets, actuals, status, and time period. A summary sheet shows interactive charts and pivot-driven views so trends are visible at a glance.
Customizable metrics: swap example metrics to match your project, department, or company goals. The structure works for a project team tracking task completion and budget or a commercial team tracking pipeline and profitability.
Presentation-ready output: formatted charts and clear tables make monthly reviews easier for managers and stakeholders. Standardized columns reduce confusion and keep reporting consistent across teams.
“We start with a proven dashboard layout so you spend time improving performance, not building sheets.”
| Area | Included | Benefit |
|---|---|---|
| Input | Owner, Target, Actual, Status | Consistent tracking |
| Summary | Charts, Graphs, Pivot Views | Faster insight for managers |
| Use Cases | Project, Sales, Operations | One layout, many goals |
How to Choose the Right KPIs and Key Performance Indicators
Good performance tracking links what we want to achieve with what we can reliably measure.
Align to goals, success criteria, and department needs
We start from business goals and list clear success criteria for each. Then we pick kpis that map directly to those outcomes.
Agreeing definitions across each department prevents confusion and keeps reports comparable across teams.
Use SMART targets
Every metric must be Specific, Measurable, Achievable, Relevant, and Time-bound.
SMART checklist: definition, measurement method, owner, and deadline. This makes responsibility and review simple.
Balance leading and lagging indicators
We recommend a mix: leading indicators show drivers (e.g., sales calls), lagging indicators show outcomes (e.g., revenue).
Limit the dashboard to a few focused kpis so managers see what matters at a glance and act fast.
| Step | What to do | Why it matters |
|---|---|---|
| Define goals | Link to strategy and success criteria | Ensures relevance and focus |
| Apply SMART | Set clear measure, owner, and time | Improves accountability |
| Balance indicators | Pick leading + lagging metrics | Tracks drivers and results |
| Agree across teams | Standardize definitions and cadence | Prevents misalignment |
kpi template excel Setup: Prepare Your Data, Metrics, and Time Periods
Start by mapping where each number comes from so the dashboard reflects real work, not guesses.
Select reliable sources: define the owner and update method for each data point. Common sources include sales CRM exports, marketing campaign reports, operations logs, finance statements, and HR records.
Choose frequency and ranges
Decide whether a metric needs weekly or monthly updates. Pick consistent time ranges so trend analysis shows meaningful patterns instead of noise.
Standardize entry and reduce rework
Agree on formats for dates, departments, currency, and units. Use simple validations and drop-down lists to stop errors before they reach the summary sheet.
- Map sources: source, owner, update method.
- Frequency: weekly vs monthly and reporting ranges.
- Format: unified columns and validation rules.
- Version control: shared drives or software for edits.
“We keep the tracking process short: checklist, set schedule, and a single owner for each metric.”
For a practical walkthrough on integrating spreadsheets and dashboards, see this step-by-step guide.
Step-by-Step: Customize the KPI Dashboard in Excel to Fit Your Work
Start by matching the dashboard fields to real tasks so the sheet reflects daily work, not abstract goals.
We replace the sample metrics with the exact indicators our project needs. Swap project-focused lines for sales or profitability measures when those are more relevant to management priorities.
Swap out template KPIs to match your tasks, process, and management priorities
List each task and assign an owner. Then map that item to a dashboard row so owners see their responsibilities at a glance.
Tip: keep the structure intact—change names and formulas, but avoid removing core summary cells.
Set targets, thresholds, and status indicators for quick performance checks
Define clear targets and colour thresholds: green = on track, amber = at risk, red = off track. These visual cues make weekly standups faster.
Use simple formulas to convert actuals into status labels like On Track, At Risk, or Off Track.
Customize during planning so project managers and teams agree on objectives early
We recommend finalizing metrics in planning sessions so managers, sponsors, and the team agree on goals and ownership before work starts.
This avoids mid-project disputes and keeps the dashboard useful for monthly reviews and decision-making.
- We walk through replacing sample KPIs without breaking the dashboard structure.
- We align the KPI list to tasks, recurring processes, and management priorities for the quarter.
- We set targets, thresholds, and clear status indicators for instant checks in standups.
“Customise early: it saves time and keeps everybody accountable.”
Need help tailoring a dashboard for your project or team? Whatsapp message us to know more about KPI @ +6019-3156508 and our local representative will be in touch.
Build Clear Visuals: Charts, Graphs, and At-a-Glance KPI Reporting
Clear visuals turn numbers into action during a short management meeting. We design dashboards so the most important data shows on one screen. That lets teams compare progress and discuss fixes, not hunt for figures.
Use conditional formatting to highlight wins, risks, and missed targets
We apply simple colour rules so wins show green, risks amber, and misses red. This makes status obvious without explanation.
Result: faster standups and clearer ownership for each indicator.
Create interactive views with filters and pivot tables for faster analysis
Filters and pivot tables let managers slice data by month, team, or region. Interactive views reduce report turnaround and improve on-the-spot analysis.
Choose the right chart types for progress, budget health, and performance indicators
We use line charts for trends, bar charts for side-by-side comparisons, and simple gauges or traffic lights for status. For budget health, a planned vs actual bar with variance labels tells the story at a glance.
“Visuals should point to causes, not hide them.”
| Visual | Best use | Why it works |
|---|---|---|
| Line chart | Progress over time | Shows trends and seasonality |
| Bar chart | Comparisons across teams | Easy side-by-side view |
| Gauge / traffic light | Status and thresholds | Instant on-track/at-risk view |
| Pivot table | Interactive slicing | Fast analysis by dimension |
Tip: keep the dashboard clean. Limit charts to the few performance indicators that drive decisions and your meetings will stay focused.
Real-World KPI Template Examples by Department
Practical KPI sets help teams measure what matters; below we map common metrics to each department’s needs. These examples are swap-ready so Malaysian teams can reuse fields and keep reports consistent across areas.
Sales
We list measurable sales metrics that track goals, pipeline efficiency, and profitability.
- Revenue vs target — monthly and YTD comparisons.
- Conversion rate and win rate for pipeline quality.
- Pipeline coverage and average deal cycle time.
- Profitability by segment to spot margin gaps.
Marketing
Marketing metrics link spending to outcomes and improve campaign decisions.
- Campaign ROI and cost per lead.
- Lead-to-opportunity rate and lead quality indicators.
- Channel performance vs goals for budget allocation.
HR
HR dashboards focus on recruitment, retention, and climate so leaders can act on trends.
- Turnover rate and average tenure.
- Abandonment rate (early leavers) and hiring volume.
- Training usefulness and work climate indicators.
HR dashboards help spot unusual turnover in a department and prompt targeted action on workload or pay alignment.
Project
Project KPIs reduce delivery risk and keep tasks on track.
- Task completion status and pending items.
- Schedule variance and milestone progress.
- Budget tracking: planned vs actual and variance.
| Department | Key Metrics | Purpose | How it rolls up |
|---|---|---|---|
| Sales | Revenue vs target, conversion, pipeline | Measure growth and efficiency | Contributes to company revenue goals |
| Marketing | Campaign ROI, cost/lead, lead quality | Optimize spend and channel mix | Feeds qualified leads into sales pipeline |
| HR | Turnover, tenure, hiring volume | Monitor workforce stability | Informs capacity planning and costs |
| Project | Completion rate, schedule variance, budget | Reduce delivery risk and overruns | Ensures projects meet strategic goals |
We keep each department’s set aligned to company goals so the metrics roll up into a single performance view. Swap fields as needed and use the same columns for easy aggregation during monthly reviews.
Keep Your KPI Tracking Accurate: Governance, Updates, and Accountability
When roles and rules are clear, dashboards stop being noisy and start guiding decisions. We define governance as the system that keeps tracking accurate over time: ownership, update rules, definitions, and quality checks.
Assign owners and set update rules
We assign a single owner for each metric and document who updates the data, where it comes from, and how often. This reduces duplicate work and saves time during monthly reports.
Review cadence to keep metrics relevant
We run a light monthly check and a quarterly review of metric relevance. These reviews ensure the dashboard reflects shifting priorities and supports management decisions.
Use trends to spot bottlenecks
We compare month-over-month and quarter-over-quarter trends, and we benchmark departments against each other. Trend analysis highlights blockers so teams can act fast.
“Clear governance shortens review cycles and improves cross-team alignment.”
| Governance Area | Action | Benefit |
|---|---|---|
| Ownership | Name owner, contact, update schedule | Faster edits, fewer errors |
| Quality | Validation rules and spot checks | Trustworthy data for analysis |
| Cadence | Monthly updates, quarterly relevance review | Dashboard stays aligned to goals |
| Resources | Eliminate duplicate reports | Saves time and protects resources |
Result: governance ties transparent updates to success. When teams know who owns the numbers, decisions are faster and the company moves with confidence.
Conclusion
A simple, repeatable tracking process helps teams focus on what moves results.
We recap the core workflow: choose the right measures, prepare clean data, customise the dashboard file, and use clear visuals to tell the performance story.
Using standard templates speeds setup, enforces consistent definitions, and strengthens accountability across the company.
Keep the dashboard single-screen and decision-focused, with targets and trend context tied to goals. Start with one department, validate the process, then scale to company-wide reporting as updates stabilise.
Treat tracking as ongoing: review metrics and thresholds as strategy shifts. For help selecting measures or tailoring the dashboard, Whatsapp message us to know more about KPI @ +6019-3156508.
FAQ
What is a KPI dashboard and why does it matter for Malaysian businesses?
A KPI dashboard is a single-screen view that turns performance data into clear metrics we can act on. For Malaysian companies, it helps stakeholders from operations to marketing see results at a glance, align teams on goals, and speed up decisions that improve revenue, efficiency, and customer outcomes.
How do key performance indicators turn performance data into decisions?
We translate raw data into meaningful indicators that match business goals. By setting targets, thresholds, and visual signals, we focus attention on gaps and trends so managers can prioritize resources, adjust strategies, and track progress over time.
What will we get in the free dashboard download?
The free download includes a pre-built dashboard layout with charts, graphs, tracking fields, and presentation-ready reporting. It’s configurable for teams, departments, projects, and company-wide objectives so managers and stakeholders can share insights fast.
Can we customize the metrics for different teams and departments?
Yes. We provide customizable metrics for sales, marketing, HR, finance, and project teams. You can swap out default indicators, set SMART targets, and tailor views so each department tracks what matters most to their success.
How should we choose the right indicators for our organisation?
Start by aligning indicators to your strategic goals and success criteria. We recommend using SMART targets, balancing leading and lagging indicators, and selecting measures that are specific, measurable, achievable, relevant, and time-bound.
What data sources should we use to populate the dashboard?
Use reliable sources for sales, marketing, operations, finance, and HR such as CRM systems, ad platforms, accounting software, and HRIS. Consistent, verified inputs improve trend analysis and reduce the time we spend reconciling figures.
How often should we update metrics and reporting periods?
Define measurement frequency by the metric’s nature—daily or weekly for operational KPIs, monthly or quarterly for strategic indicators. We standardize time ranges so trends are comparable and teams can act on timely information.
What steps help ensure accurate and consistent tracking?
Standardize data entry, assign KPI owners, and document update processes. Regular reviews and governance reduce errors, keep dashboards relevant, and make accountability clear across teams.
How do we customize the dashboard to fit our processes and tasks?
Start during planning by agreeing on objectives with project managers and stakeholders. Swap out default measures, set targets and status indicators, and configure filters so the dashboard mirrors your workflows and decision cycles.
Which visual tools best show progress, budget health, and risks?
Use line charts for trends, bar charts for comparisons, and gauge or traffic-light indicators for status. Conditional formatting and pivot-based interactive views help highlight wins, risks, and missed targets at a single glance.
Do you include examples for different departments?
Yes. We include ready-to-use examples for sales (pipeline and profitability), marketing (ROI and lead quality), HR (recruitment and retention), and projects (task completion and budget tracking) so teams can adopt good practices quickly.
How do we keep dashboards useful as priorities change?
Schedule regular KPI reviews, update metrics as strategies evolve, and use trend comparisons to spot bottlenecks. Assign owners who will maintain and revise indicators so dashboards stay aligned with current goals.
Will this solution save time and resources for our managers?
Yes. The structured layout, automated calculations, and presentation-ready reporting reduce manual work. Managers spend less time compiling data and more time making decisions that drive performance.