
Did you know that a recent industry report found over 90% of guest satisfaction hinges on fundamental operational standards like cleanliness? This startling fact from the AHLA 2025 report highlights a critical truth for property owners.
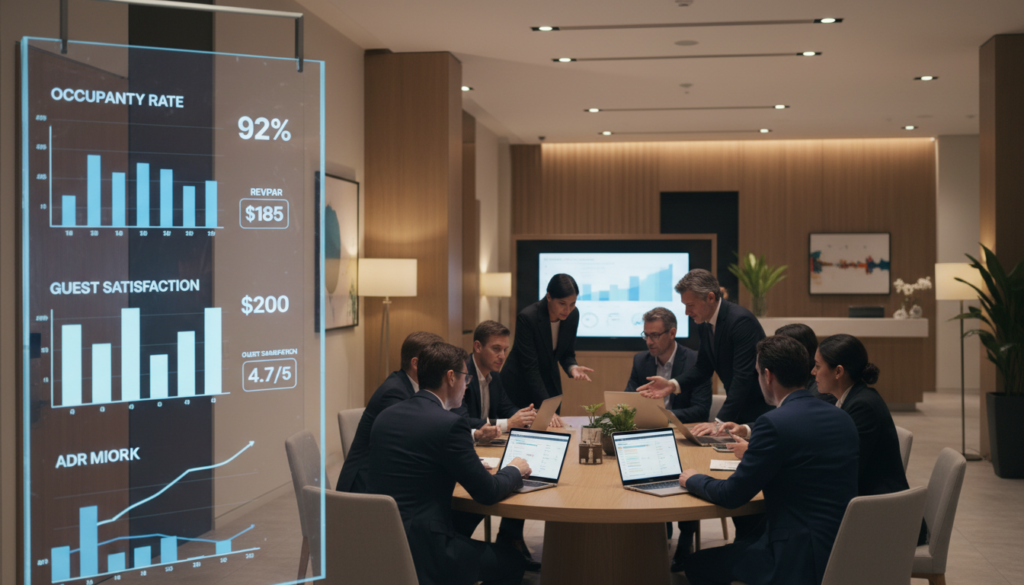
Success in the competitive hospitality landscape demands more than intuition. It requires transforming raw data into clear, actionable decisions.
Maintaining high operational standards is no longer optional; it’s fundamental for long-term sustainability. We help you gain visibility into every aspect of your property’s functionality.
By tracking the right metrics, managers can pinpoint significant improvements. This directly boosts overall performance and ensures you meet modern guest expectations.
These essential indicators serve as a powerful learning tool. They identify strengths and weaknesses within your specific operations and management, guiding strategic growth.
Key Takeaways
- Operational standards like cleanliness are a primary driver of guest experience.
- Data must be transformed into actionable decisions for a property to thrive.
- High standards are fundamental for success in the competitive hospitality industry.
- Key performance indicators provide crucial visibility into business functionality and sustainability.
- Tracking the right metrics leads to improved performance and revenue.
- These metrics act as a learning tool to identify operational strengths and weaknesses.
- A data-driven approach is essential for meeting modern guest expectations.
Understanding the Importance of Hotel KPIs
For any lodging establishment, understanding its operational health requires moving beyond gut feelings to concrete numbers. A key performance indicator is a measurable value that shows how well a business is meeting its set objectives.
We utilize these indicators to evaluate how a property is performing across revenue, occupancy, operations, and guest experience.
How KPIs Reflect Operational Success
These metrics provide a comprehensive view. Managers can compare past findings against current goals.
This turns daily activities into a clear story of success. It highlights where a property excels and where attention is needed.
Overview of Hotel Industry Metrics
By tracking the right data, you can identify the many factors affecting performance. This allows for smart, data-driven adjustments.
Selecting the correct metrics is crucial for long-term sustainability and profit. A focused approach ensures resources are used effectively. For a detailed look at essential figures, explore our guide on key financial metrics.
This foundational understanding is the first step toward a powerful, data-driven strategy.
Core Financial Metrics for Hotels
At the heart of every profitable property lies a clear understanding of its core financial metrics. We focus on figures that reveal how effectively you generate income from your assets.
These calculations transform raw numbers into a story of your business’s financial health. They guide pricing and operational decisions for better sustainability.
Average Daily Rate and RevPAR Explained
The average daily rate (ADR) measures the average income earned per paid room each day. It is calculated by dividing total room revenue by the number of rooms sold.
This figure shows your pricing power. A strong daily rate is vital for profitability.
Revenue per available room (RevPAR) gives a broader view. It multiplies your average daily rate by your occupancy rate.
RevPAR indicates how well you fill rooms at profitable prices. It is a key gauge of overall financial performance.
GOPPAR and TRevPAR for Comprehensive Analysis
For a deeper analysis, look at Gross Operating Profit per available room (GOPPAR). This metric divides gross operating profit by total available rooms.
GOPPAR accounts for operating costs. It shows true profitability after expenses.
Total revenue per available room (TRevPAR) includes all income streams. This includes food, beverage, and other services divided by total available rooms.
Together, these metrics ensure you understand how every square foot contributes to your success.
Operational and Housekeeping Performance
Swift room preparation and impeccable cleanliness are not just tasks; they are measurable pillars of guest satisfaction. We govern these critical operations with specific, actionable metrics.
Measuring Room Turnaround and Cleaning Quality
Room Turnaround Time tracks the average duration to clean and prepare a room between departures. A swift turnaround maximizes available rooms for new bookings, directly supporting revenue.
It also minimizes guest wait times. Monitoring this data helps streamline staff productivity, like the number of rooms cleaned per hour.
The Cleaning Quality Score comes from routine inspections. This vital metric tracks cleanliness levels in guest rooms and public areas.
Our approach uses specialized software for standardized checks. This identifies recurring issues or training needs efficiently.
By monitoring these areas, we ensure the housekeeping team meets the high standards guests expect. These kpis are fundamental for a positive experience.
They allow managers to improve overall property performance. Consistent excellence in these operations builds a reputation that drives repeat business for hotels.
Enhancing Guest Experience Through Effective KPI Tracking
Modern travelers share their experiences freely online, making every review a direct reflection of your operational effectiveness. We transform this feedback, along with key stay metrics, into a powerful tool for elevating service.
This approach moves beyond simple number-crunching. It builds a loyal customer base that drives sustainable growth.
Guest Review Impact on Business Growth
Online reviews and star ratings are a goldmine of insight. They show how efficiently your property operates and pinpoint specific improvements.
Happy guests are likely to return and recommend your establishment. This directly generates more revenue long-term.
Using ALOS and Occupancy Rates to Improve Service
The occupancy rate reveals your demand levels. We calculate it by dividing occupied rooms by total available rooms.
Average Length of Stay (ALOS) measures how long people stay. It is found by dividing total occupied room nights by the number of bookings.
Analyzing these figures together helps us understand customer behavior. This knowledge allows for better staff scheduling and personalized service.
| Metric | Calculation | Primary Business Insight |
|---|---|---|
| Occupancy Rate | (Total Occupied Rooms / Total Available Rooms) * 100 | Indicates real-time demand and helps forecast staffing needs. |
| Average Length of Stay (ALOS) | Total Occupied Room Nights / Number of Bookings | Guides pricing for extended visits and resource allocation. |
| Guest Satisfaction Score | Average of online review ratings (e.g., 1-5 stars) | Directly correlates with repeat booking likelihood and reputation. |
By analyzing these metrics, we uncover the key drivers of new bookings and repeat business. Our specialized software simplifies this analysis for clearer performance insights.
This turns raw data into a superior guest experience.
Driving Marketing and Booking Strategies with KPI Data
With half of all travelers seeking personal recommendations, your digital presence must work harder to capture direct bookings. This reality makes a data-driven approach to marketing non-negotiable for sustainable growth.
We transform raw numbers into a clear roadmap. This guides where to invest your budget and how to improve guest acquisition.
Leveraging Channel Insights
Not all booking sources are created equal. We analyze channel performance to see which partners—like online travel agencies or your own website—deliver the most valuable reservations.
This data reveals your most profitable guest segments. It ensures your marketing budget targets high-performing channels.
Optimizing Online Conversion Rates
Your website’s conversion rate is critical. It measures the percentage of visitors who complete a booking.
We track Cost Per Acquisition (CPA) to evaluate marketing efficiency. A low CPA means you are gaining new customers cost-effectively.
By optimizing these rates, we help secure more direct bookings. This strategy maximizes revenue across all digital and traditional channels.
The result is a streamlined, profitable booking engine for your property.
Exploring "hotel kpi" as a Key Business Driver
The true power of data lies not in collection, but in selecting the right figures that drive meaningful business outcomes. We define these critical indicators as measurable values that show success or failure in specific operational areas.
These metrics are numbers that track progress toward a clear goal. They help you run your property effectively and efficiently.
By exploring this concept as a core driver, we help identify and fix weak points in your management and daily operations. This turns raw information into powerful strategies for improvement.
We emphasize there is no single right way to build a metric. You must choose the ones most relevant to your unique business model and objectives.
Tracking the correct indicators allows you to achieve your goals. It ensures your property stays competitive in a fast-moving industry.
| Metric Category | Primary Business Purpose | Example Indicator |
|---|---|---|
| Financial Performance | Track income, profitability, and cost control | Gross Operating Profit per Available Room |
| Operational Efficiency | Monitor staff productivity and resource use | Average Room Turnaround Time |
| Guest Experience | Measure satisfaction and loyalty drivers | Net Promoter Score (NPS) |
This focused approach transforms data from a simple report into a key driver for sustainable growth and superior customer experience.
Leveraging Technology and Automation for KPI Tracking
Advanced technology now allows property managers to automate the collection and analysis of critical business data in real-time. This shift from manual tracking provides a dynamic view of your property’s health.
We leverage specialized software to transform raw numbers into actionable insights. This enhances both operational efficiency and long-term profitability.
Implementing Real-Time Data Analytics
Real-time analytics empower you to make faster, smarter adjustments in any market condition. This proactive approach protects your revenue and margins effectively.
Systems like Mews provide actionable guest data and intelligent automation. Seamless integrations improve overall property performance across all service areas.
Case Examples of Automated KPI Systems
Major brands trust automated solutions for consistent quality. Hotel inspection software like GoAudits is used by Hilton, Marriott, and Choice Hotels.
These systems simplify tracking with digital checklists and centralized monitoring. Managers can view scores for employees, departments, and properties using advanced filters.
| Software Solution | Key Features for Hospitality | Trusted By Major Brands |
|---|---|---|
| Mews | Actionable guest data, intelligent automation, seamless integrations | Various independent and chain properties globally |
| GoAudits | Digital checklists, real-time analytics, centralized performance monitoring | Hilton, Marriott, Choice Hotels |
Automation turns complex metrics into clear, daily management tools. This ensures your operations meet high standards and deliver exceptional guest services.
Turning KPI Data into Actionable Business Strategies
Data alone cannot drive improvement; it must be paired with decisive action plans to enhance business outcomes. We help you move from insight to execution, transforming your property’s metrics into a roadmap for growth.
Targeting Weaknesses and Maximizing Strengths
Our analysis pinpoints repeated errors or areas with multiple operational inefficiencies. This allows for targeted corrective actions, like refresher training or updated workflows.
We also develop performance-based recognition programs. These reward high-performing staff members, motivating your entire team.
Focusing on your existing strengths is equally vital. It allows you to further improve those areas for better overall results.
By listening to your guests and checking your numbers regularly, you can plan effectively. This ensures your hospitality business remains successful and competitive.
These strategies turn your data into a powerful tool for sustained performance and increased revenue.
Get More Information - Contact Us via WhatsApp
Our expert consultants are just a message away, ready to translate complex metrics into your growth story. We provide personalized guidance tailored to your specific property’s needs.
Taking action on your performance data is the final, crucial step. Let us help you implement the insights from this article.
Please WhatsApp to +6910-3156508 for more information
Reach out for a detailed discussion on our expert services. We can help you select the right key indicators for your hospitality business.
Our team offers support to implement automated software solutions. These tools track revenue, occupancy, and operational data seamlessly.
Contact us to develop data-driven strategies. We focus on maximizing your financial results and enhancing guest experience.
Message our consultants to learn proven methods for improving operations and staff management. We are here to drive your success in this dynamic industry.
Please WhatsApp to +6910-3156508 for more information today.
Conclusion
In today’s competitive landscape, the clarity provided by the right metrics is your ultimate strategic advantage. Understanding these essential indicators is crucial for a clear view of your property’s performance and for spotting areas to improve.
We have shown how tracking financial, operational, and guest experience metrics refines pricing and strengthens your overall business. Connected hospitality platforms offer real-time visibility across all departments.
This enables smarter management decisions. Remember, collecting data only adds value when you act on it to fix weaknesses and boost strengths.
Start your journey toward data-driven growth now. Consistently monitoring these indicators ensures long-term success in the industry. The right software and strategies turn insights into superior operations and increased revenue.
FAQ
Why are performance indicators critical in the hospitality industry?
We believe key performance indicators are vital because they translate complex operational data into clear, actionable insights. They reflect the health of our business, showing us exactly where we excel and which areas need immediate attention to drive profitability and enhance guest satisfaction.
What is the main difference between Average Daily Rate and RevPAR?
While both are essential financial metrics, they measure different things. Average Daily Rate (ADR) tells us the average earned per occupied room. Revenue Per Available Room (RevPAR), however, combines occupancy and rate to show total earnings per available room, giving a fuller picture of our revenue generation.
How do GOPPAR and TRevPAR provide a more comprehensive financial analysis?
GOPPAR (Gross Operating Profit Per Available Room) moves beyond room revenue to include all operating income and costs, revealing our true operational efficiency. TRevPAR (Total Revenue Per Available Room) expands the view to all revenue streams, like food and beverage or spa services, showing our property’s total earning capacity.
Which operational metrics best measure housekeeping efficiency?
We focus on room turnaround time and cleaning quality scores. Tracking the time to prepare a room for the next guest ensures operational speed, while systematic quality checks guarantee standards are met, directly impacting our reputation and the next guest’s experience.
How can tracking guest reviews influence our business growth?
Guest feedback is a direct performance indicator. By analyzing review scores and sentiment, we identify specific strengths to promote and weaknesses to address. This proactive approach improves our service, boosts online ratings, and directly influences booking decisions, driving revenue.
What channel insights are most valuable for our marketing strategy?
We analyze cost and conversion data from each booking source, like Online Travel Agencies (OTAs), our direct website, and global distribution systems. This shows us which channels deliver the most profitable reservations, allowing us to optimize our marketing spend and commission costs effectively.
How does technology improve our KPI tracking process?
Modern property management systems and business intelligence platforms automate data collection. This provides us with real-time dashboards, eliminating manual errors and giving our team instant access to critical metrics. This allows for faster, more informed decision-making across all departments.
How do we turn KPI data into actionable business strategies?
We start by regularly reviewing our data to spot trends. If a metric like our direct booking conversion rate is low, we launch a targeted campaign with special offers. By consistently linking data trends to specific actions, we systematically strengthen our operations and marketing.